Important note: This page is only educational, i.e. do not take it too serious to make investments!
MAVI Stock Data
Below is the dynamic time-series plot of the daily closing MAVI stock data, between 15 June 2017 and 20 December 2019; there are 656 days in total. Moving the cursor on the plot will tell the date and the value of the stock, and the plot can be zoomed by slicing it and un-zoomed by double left click.
Corresponding one-period percentage changes are displayed in the following dynamic plot.
Auto-correlation plot of the percentage change data is given below.
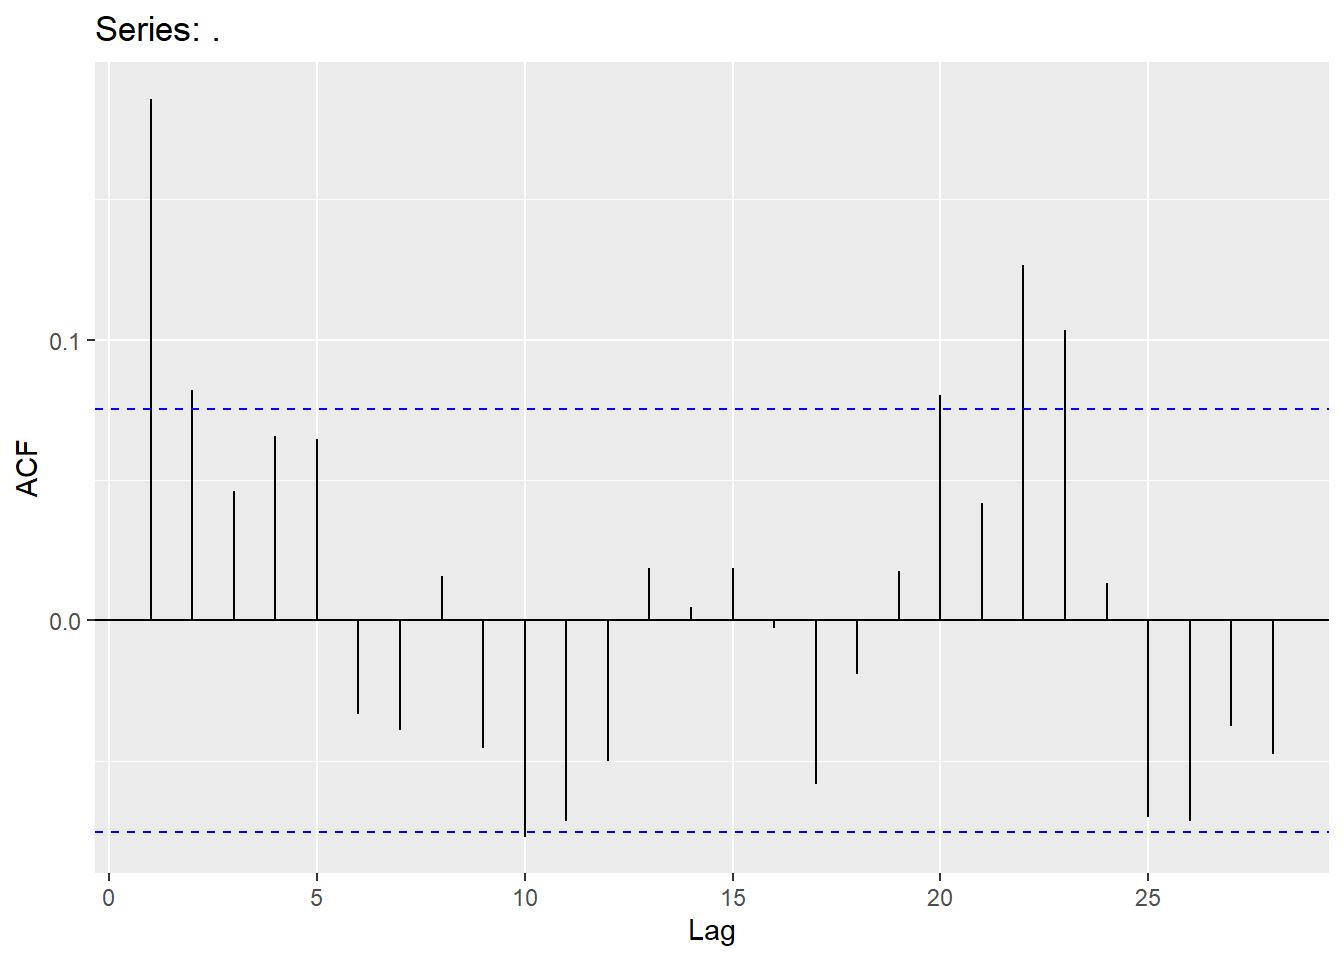
It is apparent that percentage change data is zero-mean, but not constant variance. Moreover, it serially uncorrelated as almost all the correlation coefficients are within the confidence bands.
Based on these, the so-called stochastic volatility model would be appropriate to model one-period percentage return data. The modelling framework we consider assumes that the one-period percentage change data is zero-mean Normal with a time-varying variance. For inference we wil take a Bayesian paradigm, and sample from the posterior distributions; details are skipped.
In- and out-of-sample (20 days; 23 December 2019 - 15 January 2020) predictions are displayed in the following plot, where while the former predictions are in solid lines, the latter in dashed-lines. Note that the y-axis is hundred times the variance.
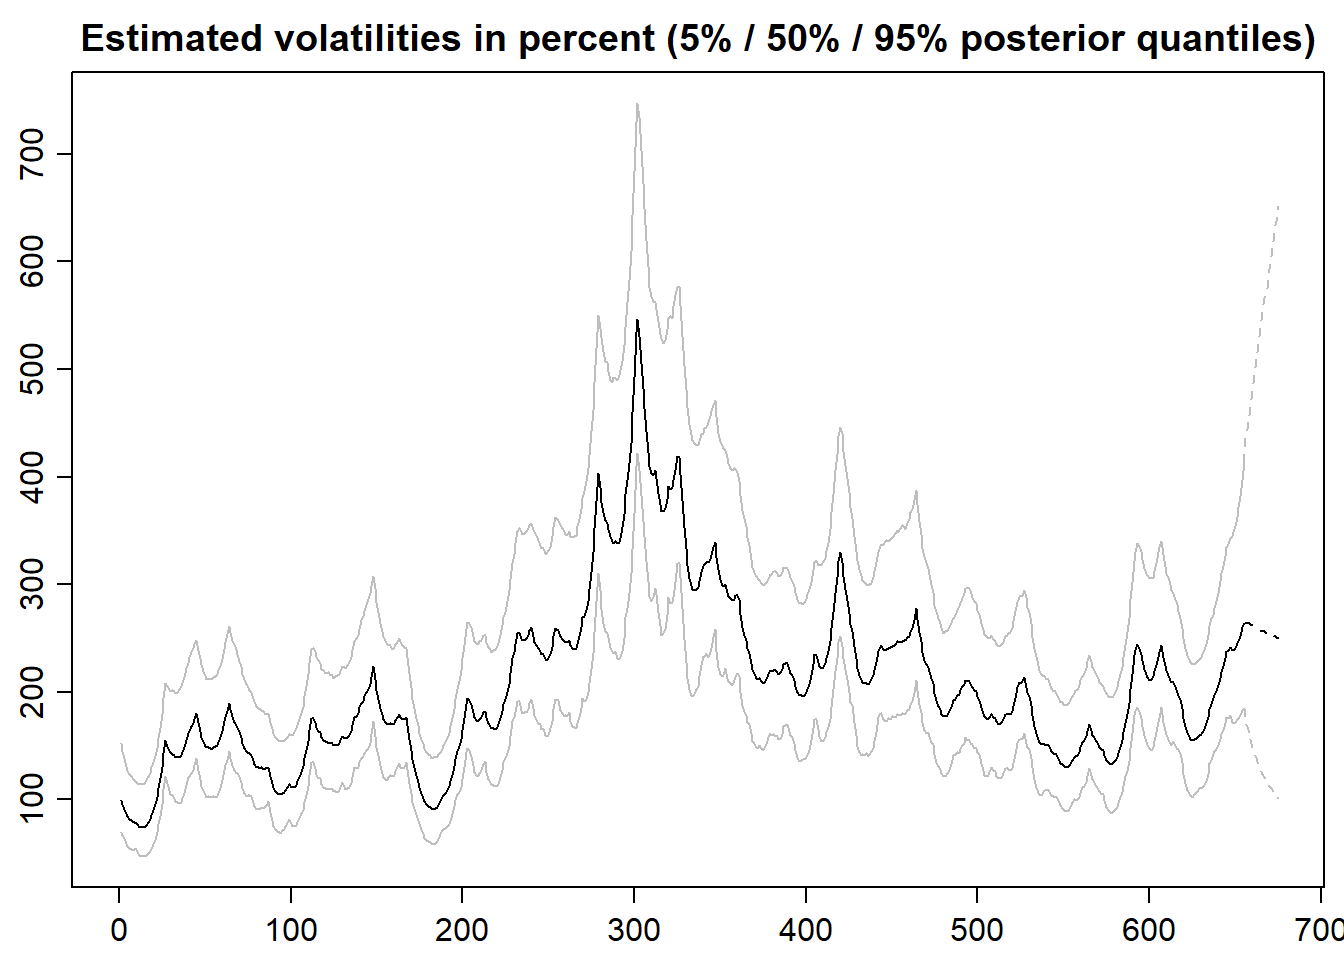
The posterior means of the out-of-sample predictions indicate that volatility tends to decrease. However, the distributions are highly right-skewed. This indicates that high volatilities are possible.